


Nifty - Weak Below 21700; Bullish above 22530 Only; RBI policy could be a Non-Event;
- Neeraj Bhatia
- Mar 31, 2024
- 6 min read

As we suggested last week, in our technical journal, the Nifty will oscillate in a wide range, and mostly in the week's trading sessions, it kept itself on the higher side, and as soon as it ran through its break out level of 22300 levels, it rallied towards all-time high but chased the all-time high with short of 10 odd points only.
The market had a strong close for the truncated week that ended on March 28, as the benchmark indices gained 1 percent with participation from most sectors barring IT after consolidation in the previous couple of weeks. The monthly expiry session for March derivative contracts had a good rally, indicating the market may be inching toward a record high soon.
Post Market Weekly Analysis
The Nifty 50 weekly Index opened at 21947.90 touched the high level of 22516 and slipped down to 21947.55 before closing at 22326.90. So the benchmark index oscillated in a range of 568.45 points over the previous week's trading sessions, finally closing with a gain of 230.15 points, i.e. in percentage term (1.04%) on a week-on-week basis.
Nifty 50 Index Monthly Chart
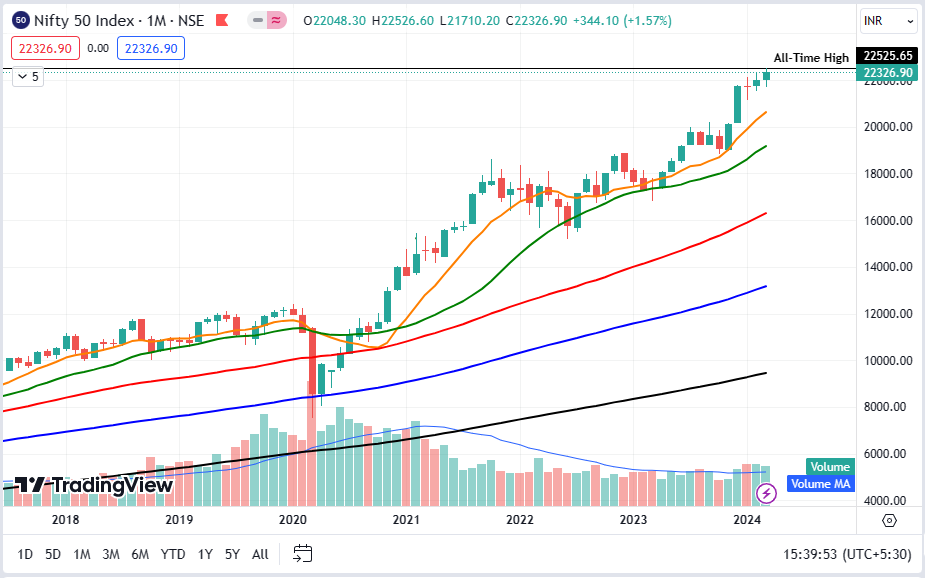
The monthly chart is still situated in a comfortable mode. Monthly volumes were good in the March series, and now the new financial series is about to start on 1st April 2025. the Nifty50 Index would become weak only below 21700 levels. We can see more bullishness, only if we see the market extend its gain above 22526 levels, which was sitting at its current lifetime high.
Nifty 50 Index Weekly Chart

On the weekly chart the Nifty 50 index closed above the 9-week Simple Moving Average, and if drifts down, it can take support at the 20-week simple moving average. And if drifts down further then the increasing channel's low level will become the support for it, which is sitting at approx 21650-21700 range.
Nifty 50 Index Daily Chart

On the daily chart, the Nifty 50 Index got a strong rejection from the all-time high level. On the last day, the candle lost approximately 50% of its gain, which was earned in the whole trading day. This makes the index bearish for Monday. But if the index will able to cross the level of 22526 decisively this time, then it can go for a big gain shortly.
Nifty 50 Weekly Fibonacci Chart Status

In the current scenario, The Nifty 50 index has touched third time its all-time high. Above it, the index will be in unchartered territory, so based on the Fibonacci series calculation, the Nifty 50 Index may touch 22748 followed by 22864. the only condition is it should protect the levels of 21700 decisively.
Nifty 50 Index Weekly Chart -with Technical Indicators

RSI Indicator Pattern
The weekly RSI stands at 67.99; it stays neutral and does not show any divergence against the price.
MoneyFlow Indicator
This weekly indicator is at 67.20 which denotes a neutral pattern. Big players may start taking their position for the new 2025 financial year from this week onwards.
MACD Indicator Pattern

The weekly MACD has shown a neutral crossover; neither bearish nor positive sentiments. The histogram is slightly in negative territory, but it is not showing any direction so far.
FII's & DIIs Cash Weekly and Monthly Activities


Outlook for the NIFTY 50 Index for the Coming Week
The first week ahead of the new financial year FY25 is expected to be positive for the market with a focus on auto sales data, manufacturing & services PMI numbers, RBI interest rate decision, and expectations for March FY24 quarter earnings
India VIX:
The weekly India VIX closed at 12.83 it touched a high of 13.18 and a low level of 12.08.
India VIX, the fear gauge, gained 5.01 percent during the week to +0.6125.
Meanwhile, the India VIX, the fear gauge, rebounded with a 5 percent uptrend to close the recent week at a 12.83 level, after a 10.74 percent correction in the previous week, but still at comfort levels.
Support Level for the Coming Week for NIFTY:
The broader support level on the technical chart could be 22000, followed by 21700 levels.
Resistance Level for the Coming Week for NIFTY:
The broader resistance level on the technical chart could be the level of 22530, followed by 22748 levels and then 22684
Crude Oil
Meanwhile, the street will also focus on the oil prices as Brent crude futures jumped to the highest closing level since October 2023, rising 2.64 percent for the last week of March 2024 to close at $87.07 a barrel after a marginal decline in the previous week.
Technically, the prices sustained above the falling resistance trendline for yet another week and traded above all key moving averages. India is the net oil importer, hence consistent increase in prices is a risk.
The crude prices rallied for the third consecutive month, rising 6.3 percent for the March month and 13 percent in the March 2024 quarter. This surge was attributed to OPEC+ output cuts and market anticipation of lower interest rates. Additionally, signs of Russia complying with OPEC production pledges, shifting the focus from exports to production, may further stimulate price increases in the crude oil market.
Important Upcoming Monthly/Weekly Activities
Auto Sales
The new financial year FY25 will start with the auto sales data for March. Hence, auto stocks including Maruti Suzuki India, Tata Motors, Hero MotoCorp, Eicher Motors, Ashok Leyland, Bajaj Auto, Mahindra & Mahindra, and TVS Motor Company will be in focus.
It is expected double-digit on-year growth in the retail two-wheeler sales during March 2024 and a single-digit increase in passenger vehicle sales, but there may be subdued performance in commercial vehicle as well as tractor sales for March 2024.
Bank loan and deposit growth numbers for the fortnight ended March 22, as well as foreign exchange reserves for the week ended March 29th, will be released on April 5th. 2024
Fed Chair Powell's Speech
Globally, the market participants will focus on the Federal Reserve Chair Jerome Powell's speech scheduled on April 3. Also, there will be speeches by several other Fed officials next week.
In last week's speech in San Francisco, Powell reiterated that the Federal Reserve is not in a hurry to go for a rate cut. With strong employment data, the Fed wants to see inflation consistently reaching closer to its 2 percent target. In a March policy meeting, Powell signaled three rate cuts this year, while investors started expecting the first rate cut in June 2024.
Global Economic Data
Further, the manufacturing and services PMI final data for March by several other nations including the US and China will also be tracked by the participants. Unemployment rate, non-farm payrolls, JOLTs job openings & quits, and factory order numbers in the US will also be watched
Technical Analysis
Technically, given the Nifty 50 reclaiming 22,300 in the recent trading session with above average volumes and holding above downward sloping resistance trendline as well as trading above all key moving averages, now people looked optimistic with all eyes on the record high of 22,526 next week.
The immediate support is placed at 22,200 and key support at the 22,000 levels.
In the Nifty 50 Index, based on the daily charts, there is high volatility in the market near the all-time high of around 22,500 levels. However, there are indications that Nifty may find support from the lows and is expected to move up further.
On the weekly chart, Nifty formed a bullish candlestick pattern with a higher high and higher low formation on the weekly charts. Additionally, it remained above the 10-week EMA, which acted as a support on a closing basis.
The next upside levels to be watched are around 22,550-22,650 in the next week, while immediate support is at 22,200-22,100 levels.
Reading Current Option Data
Options data also indicated that the Nifty 50 Index may face resistance at 22,500-22,600 levels in the new series, with support at 22,200 and 22,000 levels.
On the Call side, the maximum open interest was visible at 22,600 strikes, followed by 22,300 & 22,500 strikes, with meaningful writing at 22,300 strikes, then 22,700 & 22,600 strikes.
On the Put side, the 22,300 strikes owned the maximum open interest, followed by 22,000 & 22,400 strikes, with writing at 22,300 strikes, then 22,400 strikes.
Participant Wise Final F&O Weekly Summary

FII's, PRO, and Clients F&O Summary by Segment
1). FII's positions as of the last trading day:

2). PRO's position as of the last trading day:

3). CLIENT's position as of the last trading day:

Summary - Overall
Overall, we expect the market to continue its positive momentum with a focus on large-cap. With the start of the election in April, we believe government-centric stocks to be in focus.
Auto stocks are likely to be in the limelight next week amid the release of monthly auto sales numbers.
Besides this, the defensive pockets like IT, Pharma, FMCG, etc., may see some resilient show as they try to improve their relative strength against the broader markets.
It is strongly recommended to protect profits at higher levels. While continuing to stay highly selective in approach, a cautious outlook is advised for the coming week
Thanks for reading.
Keep Trading
Stay Invested
Regards,
Neeraj Bhatia
(Managing Director)
Disclaimer: I am a National Stock Exchange-certified Technical Analyst and Chartist but not a SEBI-registered analyst, so consult your financial advisor before taking any trade. This technical weekly post-market journal is only for learning purposes and it is downloadable free of cost. The views written here are entirely only my personal views. I am not forcing anyone to follow my thoughts. I do not have any WhatsApp Group ID or Telegram ID related to it.


Comments