


Nifty - Upward Bias still Intact, Profit bouts will continue on higher levels; Watchful for 22100-22600
- Neeraj Bhatia
- Apr 7, 2024
- 5 min read

In the previous technical journal, we suggested that the RBI event would be a non-event. The central bank left policy rates unchanged and also retained its stance of focussing on the withdrawal of accommodation.
The Nifty 50 ended flat at 22513.70 points, and on daily charts, it suggests that the index is consolidating after a sharp run-up, which is a healthy sign. The index remained sideways throughout the session, reflecting a pause in the market trend, following the formation of a hanging man pattern.
The sentiment may continue to remain sideways due to the lack of a directional breakout or pattern formation.
It turned out to be a muted session on Friday as Nifty oscillated in a narrow range and ended almost unchanged. The recent consolidation in Nifty amid weak global cues indicates time-wise correction and traders should maintain a positive bias until the Nifty holds 22,200 level.
Post Market Weekly Analysis
The Nifty 50 weekly Index opened at 22455 touched the high level of 22619 and slipped down to 22303 before closing at 22513.70. So the benchmark index oscillated in a range of 315 points over the previous week's trading sessions, finally closing with a gain of 186.80 points, i.e. in percentage term (0.84%) on a week-on-week basis.
Nifty 50 Index Monthly Chart

The Nifty 50 Index has already shifted upward its all-time high base from 22526.60 to 22619, approximately 90 points increase from last month's higher level. It seems it will continue its base towards higher side till election results declears.
Nifty 50 Index Weekly Chart

Three weeks back, we had a big bearish candle, which is completly engulfed by previous three week's bullish candles. Though we have reached to a new all-time high, we can not see run-way move direct to 23000, instead we will see profit booking bouts in each and every higher levels.
Nifty 50 Index Daily Chart

On Thursday trading session, we have seen a sell-off, but it was bought into and once again we closed on higher side of the index. There is no doubt we can again create a new all-time high, but we need to be efficient to book out profits time to time and make sure to secue the gains.
Nifty 50 Weekly Fibonacci Chart Status
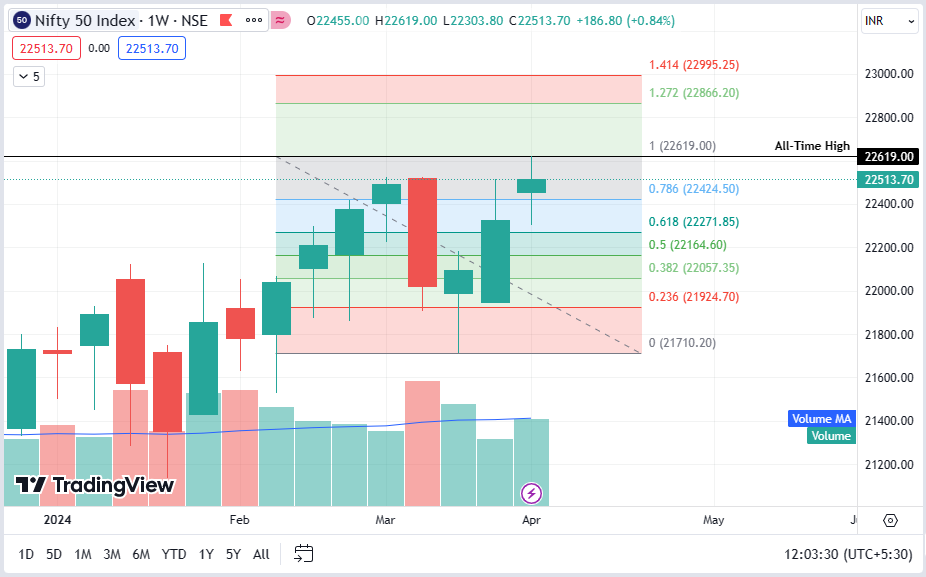
On higher side, once gain we can see either consolidation in a wide range or we can see the higher upward move. but we need to take care of the level if 22424.50 which sits on 0.786 level of fibonacci series., breaking down this level can bring downside of 22100 levels. On higher side, we will not see any run-way move, we can go up to 1.00 which is at 22600 levels.
Nifty 50 Index Weekly Chart -with Technical Indicators

RSI Indicator Pattern
The weekly RSI is 69.81; it continues to show a mild bearish divergence against the price.
MoneyFlow Indicator
This weekly indicator is at 67.79 which denotes a neutral signal.
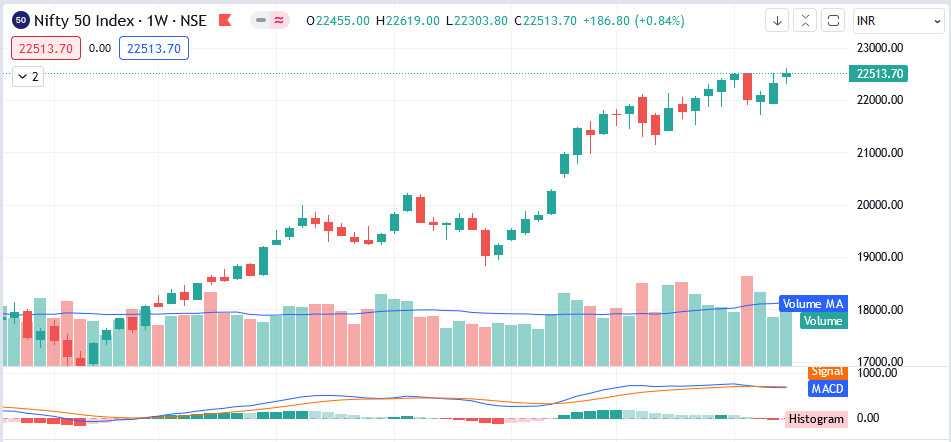
MACD Indicator Pattern
The weekly MACD is bearish and trades below its signal line.
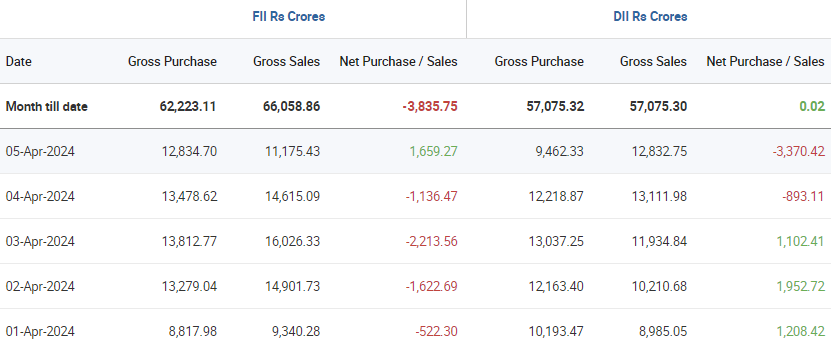
FII's & DIIs Cash Weekly and Monthly Activities
Outlook for the NIFTY 50 Index for the Coming Week
From a technical perspective, the NIFTY 50 Index will need to move past the 22550-22600 zone with a decisive volumes for any sustainable move to take place.
Further, the Options data also suggests that strong Call OI built up in this zone may continue to pose resistance for the markets. A sustainable uptrend would commence only after the Index moves past this zone; until this happens, we may see the markets nding selling pressure at higher levels increasing the need for vigilant protection of prots until a fresh breakout is achieved.
India VIX:
The weekly India VIX closed at 12.83 it touched a high of 13.35 and a low level of 10.86.
India VIX, the fear gauge, gained 5.01 percent during the week to +0.6125.
The volatility slipped further; India Vix came off by 11.65% to 11.34.
Support Level for the Coming Week for NIFTY:
The broader support level on the technical chart could be 22380, followed by 22100 levels.
Resistance Level for the Coming Week for NIFTY:
The broader resistance level on the technical chart could be the level of 22600, followed by 22790 levels.
Important Upcoming Monthly/Weekly Activities

Technical Analysis
The technical analysis of the weekly charts shows the markets being in a firm
uptrend. However, that being said, the markets are also exhibiting signs of fatigue at higher levels.
They are also showing a minor loss of internal strength as they mark incremental highs along with minor negative divergences.
All and all, while the trend continues to stay intact, there are possibilities of markets staying under some ranged consolidation. The nearest support for the Nifty exists at 20-week MA which is placed at 21691
Reading Current Option Data
Options data also indicated that the Nifty 50 Index may face resistance at 22,600-22,800 levels in the upcoming week, with support at 22,500 and 22,400 levels.
On the Call side, the maximum open interest was visible at 22,800 strikes, followed by 22,600 & 22,700 strikes, with meaningful writing at 22,800 strikes, then 22,600 & 22,700 strikes.
On the Put side, the 22,500 strikes owned the maximum open interest, followed by 22,400 & 22,300 strikes, with writing at 22,300 strikes, then 22,400 strikes.
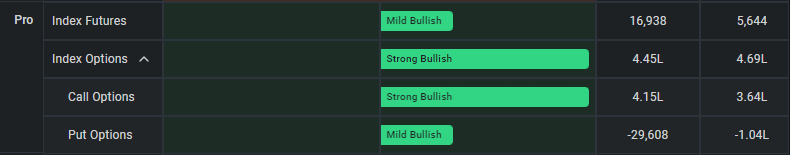
Participant Wise Final F&O Weekly Summary

FII's, PRO, and Clients F&O Summary by Segment
1). FII's positions as of the last trading day:

2). PRO's position as of the last trading day:
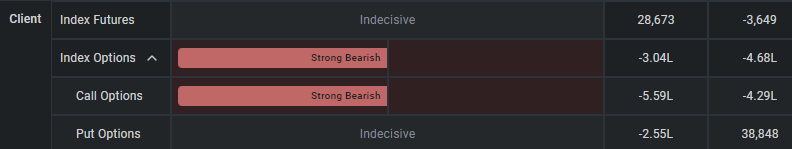
3). CLIENT's position as of the last trading day:
Summary - Overall
A quiet start is expected to the new week; the levels of 22600 and 22790 would act as potential resistance levels. Supports come in at 22380 and 22100 levels. The trading range is likely to stay modest over the coming week.
A spinning top occurred on the candles. Such candles typically have small real bodies because of little difference between the open and close price. They show the indecisiveness of the market participants.
Such formations, if they occur near the highs often have the potential to stall the upmoves.
The technical analysis of the weekly charts shows the markets being in a uptrend. However, that being said, the markets are also exhibiting signs of fatigue at higher levels.
They are also showing a minor loss of internal strength as they mark incremental highs along with minor negative divergences.
All and all, while the trend continues to stay intact, there are possibilities of markets staying under some ranged consolidation. The nearest support for the Nifty exists at 20-week MA which is placed at 21691.
Overall. we are likely to see some risk-off setup in the markets. We can expect defensive pockets like Pharma, IT, FMCG, etc., to offer better relative strength than the others.
However, the banking space is likely to stay resilient as well. It is strongly recommended that unless a strong breakout is achieved with Nifty moving past the 22550-22600 zone with a thrust, all up moves must be used to protect prots at higher levels. Low levels of VIX too remain a concern and may infuse some spikes in volatility.
A cautious approach with one eye on the protection of gains is advised for the coming week.
Thanks for reading.
Keep Trading
Stay Invested
Regards,
Neeraj Bhatia
(Managing Director)
Disclaimer: I am a National Stock Exchange-certified Technical Analyst and Chartist but not a SEBI-registered analyst, so consult your financial advisor before taking any trade. This technical weekly post-market journal is only for learning purposes and it is downloadable free of cost. The views written here are entirely only my personal views. I am not forcing anyone to follow my thoughts. I do not have any WhatsApp Group ID or Telegram ID related to it.


Comments