


Nifty-Technical Rebound expected; 22000 should be protected; Closing below 21992 may shift the downward level to 20603 soon
- Neeraj Bhatia
- May 12, 2024
- 6 min read

The Nifty 50 Index lost around 3 percent each over last week as a result of heavy FII selling. The markets are expected to consolidate during the coming week due to the Lok Sabha elections and commentary on US and Indian inflation.
In the previous week, volatility continued to remain at elevated levels with the India VIX at a 52-week high of 18.5.
The fourth phase of ongoing Lok Sabha elections will be held on Monday 13th May, and may add to some volatility. Overall, we expect the market to consolidate in a broader range and take cues from Q4 results, global factors, and news flows around the general elections.
Post Market Weekly Analysis
The Nifty 50 weekly Index opened at 22561.60 touched the high level of 22588.80 and slipped down to 21932.40 before closing at 22055.20. So the benchmark index oscillated in a range of 656 points over the previous week's trading sessions, finally closing on a loss of 420.65 points, i.e. in percentage term (-1.87%) on a week-on-week basis.
Nifty 50 Index Monthly Chart

From an all-time high, the Nifty 50 Index monthly chart has shown its downward journey till 21932. Going forward, if the monthly index closes below this level, it will confirm the bearish trend, in the short term at least 21,191 levels.
Nifty 50 Index Weekly Chart

The previous week had seen the formation of a Doji on the candles. This is followed by a large bearish engulfing candle, the body of which engulfs the prior candle's body. This, in a way, confirms the level of 22775 as an immediate top for the Nifty 50 weekly index unless taken out convincingly. For weekly upside, Nifty needs to maintain its upward journey above 22080
Nifty 50 Index Daily Chart

After seven days of continuous falls, Nifty managed to close above 100 days DMA, which is a support of running channel also. If the market breaks the level of 21930 anytime this week, it will start drifting further downward and the short-term trend will become bearish.
Nifty 50 Weekly Fibonacci Chart Status

It is expected that the support taken from the level of 0.236 should be maintained by the market at least this week, and it should move upward journey towards 0.5 levels. But this is possible that the market can take a dip again as this level is a resistance for the market.
Nifty 50 Index Weekly Chart -with Technical Indicators

RSI Indicator Pattern
The weekly RSI is at 57.19; it has formed a new 14-period low which is bearish. It also shows a bearish divergence against the price.
Money Flow Indicator
This weekly indicator is at 68.14 which suggests bearish signals.
MACD Indicator Pattern
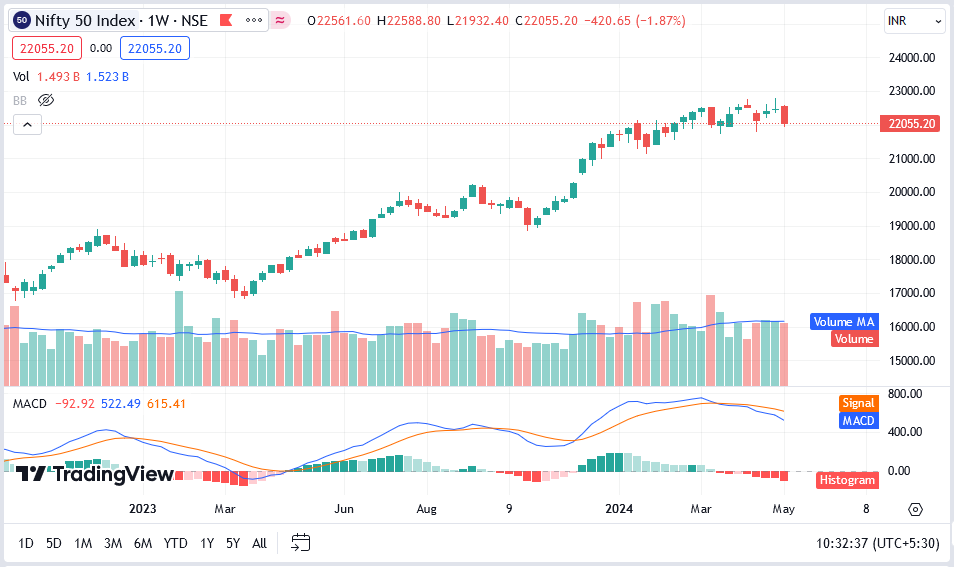
The weekly MACD is bearish and trades below the signal line. The widening Histogram indicates increased momentum on the downside.
FII's & DIIs Cash Weekly/Monthly Activities

In the week gone by, FIIs sold stocks worth around Rs 82,800 crore in the cash segment, while DIIs sold equities worth around Rs 52,152 crore. On the other hand, FIIs purchased around Rs 61,264 crore worth of equities, and DIIs purchased around Rs 69,354 crore worth. Heavy FII selling pressure and concerns over the outcome of the ongoing general elections has added to the overall pressure in the markets.
Outlook for the NIFTY 50 Index for the Coming Week
The technical analysis shows that the Nifty had created a small rising channel; it has tested the lower edge of that channel which also coincides with the 20-week Moving Average. This level, along with the 100-DMA on the daily charts makes the 22000-22100 zone the immediate support zone for the Index. A violation of this zone will invite incremental weakness for the markets.
India VIX:
It was expressed the previous week the concerns over the Nifty and VIX rising in the same direction simultaneously. As mentioned earlier, in such circumstances, the VIX often ends up acting as a lead indicator and a precursor to an impending corrective move.
The previous week had seen VIX spiking up by 33.80%. This week as well, over the past ve sessions, the VIX has surged another 26.37% to 18.47
Support Level for the Coming Week for NIFTY:
The broader support level on the technical chart could be 22000, followed by 21780 levels.
Resistance Level for the Coming Week for NIFTY:
The broader resistance level on the technical chart could be the level of 22250, followed by 22400 levels.
Important Upcoming Monthly/Weekly Activities
Inflation
The street will pay attention to the consumer price index (CPI) numbers released by the National Statistical Office on May 13. In March, India’s CPI rose 4.9 percent year-on-year. We believe the Reserve Bank of India (RBI) will be in a wait-and-watch mode until the inflation is in the targeted range of 4 percent, before considering any rate cuts
US inflation
Traders will also turn their attention to the US CPI numbers for April, which are due on Wednesday. During last week’s meeting, the Fed indicated a less-hawkish-than-expected stance, with Chair Jerome Powell ruling out rate hikes and hinting that they are still leaning towards cuts.
Crude Oil
Brent crude prices rose to $82.79 per barrel primarily due to a decline in US crude stockpiles, which suggested tighter oil supply. Additionally, expectations that the US Federal Reserve might cut interest rates later in the year also contributed to a more optimistic outlook for energy demand, further supporting the increase in oil prices.
Technical Analysis
The Nifty 50 Index may extend last Friday's recovery in the coming session given the consistent sell-off in the previous few sessions and the formation of the Inside Bar candlestick pattern on the daily charts.
But considering the big bearish candlestick pattern with the lower high formation on the weekly timeframe, the overall trend is expected to be in favor of bears in the coming week, unless the index sees a decisive close above 22,300 and sustains above the same for a few days.
The immediate support may be at 21,900 and crucial support at 21,700.
On the upside, he feels the zone between the 20 and 50 EMA, around 22,200 - 22,300, presents a formidable obstacle.
Reading Current Option Data
Options data indicated that 22,500 is expected to be the key resistance area for the Nifty 50 in the coming week, with key support at 21,500 levels.
On the weekly options front, the maximum Call open interest was seen at 23,000 strikes, followed by 22,500 and 22,800 strikes, with maximum Call writing at 22,800 strikes, then 22,500 and 22,900 strikes. On the Put side, the 21,000 strikes saw the maximum open interest, followed by 22,000 and 21,500 strikes, with the maximum writing at 21,000 strikes, then 22,000 and 21,600 strikes.
The bulls are in an uncomfortable position now as the volatility continued its northward journey for 12 days in a row. India VIX, the fear index, jumped 26 percent during the past week and has surged over 81 percent in the past 12 days.
Participant Wise Final F&O Weekly Summary

FII's, PRO, and Clients F&O Summary by Segment
1). FII's positions as of the last trading day:

2). PRO's position as of the last trading day:

3). CLIENT's position as of the last trading day:

Summary - Overall
Overall, the markets will continue to portray a tentative mood. It may show technical rebounds from current levels; however, these rebounds, if at all they occur, are likely to stay capped to their extent.
The markets continue to stay vulnerable to profit-taking bouts at higher levels.
It is strongly recommended that one must stay highly selective while making fresh purchases; it is also expected that the markets may turn a bit defensive as well. While keeping leveraged exposures at modest levels and vigilantly protecting profits, a highly cautious approach is advised for the coming week.
Thanks for reading.
Keep Trading
Stay Invested
Regards,
Neeraj Bhatia
(Managing Director)
Disclaimer: I am a National Stock Exchange-certified Technical Analyst and Chartist but not a SEBI-registered analyst, so consult your financial advisor before taking any trade. This technical weekly post-market journal is only for learning purposes and it is downloadable free of cost. The views written here are entirely only my personal views. I am not forcing anyone to follow my thoughts. I do not have any WhatsApp Group ID or Telegram ID related to it.


Comments