


Nifty-Geopolitical Tensions, Corporate Earnings, Election Week will increase VIX; Wide-Range Volatile week ahead
- Neeraj Bhatia
- Apr 14, 2024
- 6 min read

The Nifty reached a fresh lifetime high of 22775, but at the same time, it came off from those highs as well. The trading range also got narrower as the Nifty oscillated in a 271-point range. Volatility increased slightly; India Vix rose marginally by 1.72% to 11.53.
Post Market Weekly Analysis
The Nifty 50 weekly Index opened at 22578 touched the high level of 22775 and slipped down to 22503 before closing at 22519.40. So the benchmark index oscillated in a range of 271 points over the previous week's trading sessions, finally closing with a gain of 5.70 points, i.e. in percentage term (0.03%) on a week-on-week basis.
Nifty 50 Index Monthly Chart

The level of 22297 is the most important immediate support on a monthly chart, below this level, the monthly chart will become weak and bears can make their grip on the market. The level of 22000 and then 21700 would be the next support. It is too early to say anything about the monthly chart.
Nifty 50 Index Weekly Chart

On the weekly chart, the index has started showing weakness. The maximum gain earned in the current week has been wiped out. The weekly fall was averted by 3 points only. Closing below the level of 22516 could have brought a new breakdown Now for the coming week, closing below 22500 levels anytime during the week, could bring the index down to 22300, and below that it could touch the 22200-22100 range. It is to be noted that the next support of 20Week SMA is placed at 21800 only.
Nifty 50 Index Daily Chart

On the daily chart, the Inde is closed below the 9-Day SMA, which was placed at 22542, so for the coming week, the index is weak, below 22503, and it can drift down immediately to 22268, before taking support from 22150, which is placed at the 50-Day SMA.
Nifty 50 Weekly Fibonacci Chart Status

The weekly index is settled at approximately 0.5 levels, which indicates the wide-range consolidation in the coming week's trading. The wide range could be between 22200 to 22650.
Nifty 50 Index Weekly Chart -with Technical Indicators
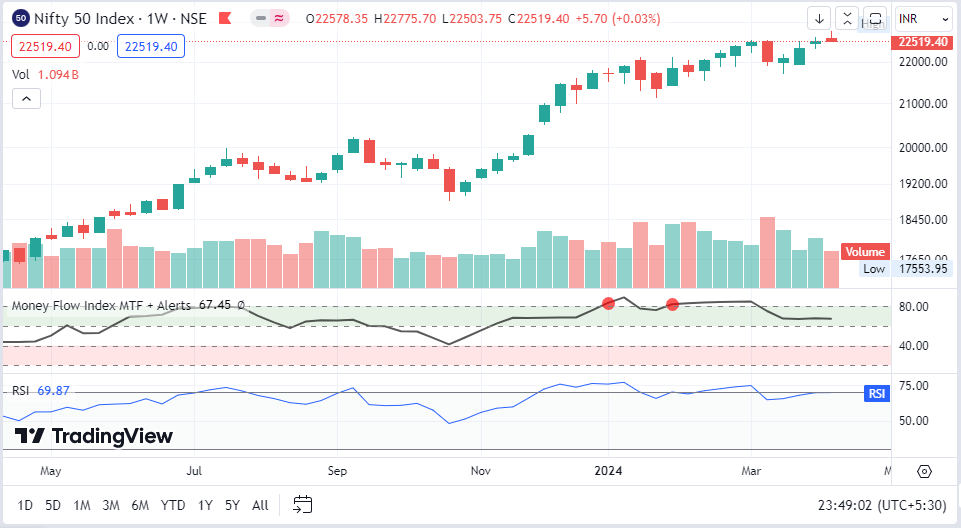
RSI Indicator Pattern
The weekly RSI is at 69.87; it has crossed under 70 from the overbought zone. When subjected to pattern analysis, RSI continues to show negative divergence against the price. It has also formed a new 14-period low which is bearish.
MoneyFlow Indicator
This weekly indicator is at 67.45 which denotes a weak signal, as FIIs are taking money out from the equities on a regular basis.
MACD Indicator Pattern

The weekly MACD is bearish and stays below its signal line, which see
ems a bearish sign for the coming week.
FII's & DIIs Cash Weekly and Monthly Activities
Foreign institutional investors sold more than Rs 8,000 crore worth of shares last Friday and over Rs 6,500 crore shares during the week, taking the total current month's net outflow to Rs 10,362 crore in the cash segment.
It is a general feeling that the FII outflow may continue in the near term given the rising geopolitical tensions, fears of changes in the India-Mauritius tax treaty, and elevated US bond yields, though largely FII selling will be absorbed by the domestic institutional investors' money. DIIs have net bought Rs 12,233 crore worth of shares in the last week.
The 10-year US bond yields settled at 4.53 percent last Friday, against 4.4 percent in the previous week, while the US dollar index jumped to 106.01, up from 104.30 on week-on-week basis.
Outlook for the NIFTY 50 Index for the Coming Week
The previous week was a truncated one because Thursday was a trading holiday on account of Eid-ul-Fitr. The coming week is also truncated with Wednesday being a holiday on account of Ram Navmi.
Due to this Banknifty Options has its shortest expiry as they would expire as early as Tuesday. The level of 22775 creates a new intermediate top for the markets; Over the coming days, no runaway up move is expected so long as the Nifty stays below this point.
At the same time, the nearest support for the index exists much below the current levels at 20-week MA which is placed at 21827. By and large, the markets are likely to stay in a broad trading range.
India VIX:
The weekly India VIX closed at 11.53 it touched a high of 11.74 and a low level of 10.61.
India VIX, the fear gauge, gained 01.72 percent during the week to +0.1950.
The volatility rose marginally by 1.72% to 11.53.
Meanwhile, the lower volatility seems to keeping the bulls in a comfortable position, but we can see some increase in volatility as the market approaches the first phase of general elections
Support Level for the Coming Week for NIFTY:
The broader support level on the technical chart could be 22400, followed by 22280 levels.
Resistance Level for the Coming Week for NIFTY:
The broader resistance level on the technical chart could be the level of 22650, followed by 22775 levels.
Important Upcoming Monthly/Weekly Activities
In the coming week, the maximum focus will be on the domestic cues including the quarterly earnings season.
The much-awaited Lok Sabha polls will start next week, with the first phase taking place on April 19. A total of 102 constituencies in 21 states and union territories are included in the first phase of elections.
Domestic Economic Data
On the domestic front, the market participants will also focus on the minutes of the monetary policy meeting held in the first week of April, which will be released on Friday, April 19. The Monetary Policy Committee had left the repo rate unchanged at 6.5 percent in a seventh consecutive meeting in April.
Further, the WPI inflation numbers for March will be announced on April 15, while bank loan and deposit growth for the fortnight ended April 5, and foreign exchange reserves for the week ended April 12, will be released on April 19.
Global Economic Data
On the global front, all eyes will be on China's GDP numbers for the first quarter of the current calendar year. Most economists feel the world's second-largest economy is expected to maintain the 5 percent growth mark for the March quarter, against the 5.2 percent economic growth expansion it recorded in Q4 of 2023.
Further, the focus will also be on the US retail sales data for March and jobs data, as well as March inflation numbers by Europe, the United Kingdom, and Japan.
The speeches by several Fed officials including Logan, Daly, Mester, Bostic, and Goolsbee during the coming week will also be watched.
Technical Analysis
Technically, it is advised caution, especially amid uncertain global market conditions, though the Nifty 50 managed to defend 22,500 after Friday's sell-off.
The level of, the 22,300-22,200 zone is expected to act as a support for the index next week as breaking the same can drag the index towards the 22,000 mark and any up move is likely to be possible only above 22,800 where it faces a lot of resistance in the passing week.
"With the technical indicators displaying weakness, the Nifty may slide into a period of consolidation.
The zone of 22,200-22,300 will act as crucial support for the index as it is the 50 percent Fibonacci retracement level of its prior upward rally (21,710-22,775).
Reading Current Option Data
The weekly options data indicate that 22,200-22,000 is expected to be a key support area in the coming days, whereas the Nifty 50 may face resistance at 22,600-22,700 levels.
On the Call side, the maximum open interest was visible at 22,700 strike, followed by 23,000 strike, with meaningful Call writing at 22,700 strike, then 22,600 strike. On the Put side, the 22,200 strikes owned the maximum open interest, followed by the 22,000 strikes with writing at similar strikes in a similar sequence.
Participant Wise Final F&O Weekly Summary

FII's, PRO, and Clients F&O Summary by Segment
1). FII's positions as of the last trading day:

2). PRO's position as of the last trading day:

3). CLIENT's position as of the last trading day:

Summary - Overall
The Technical analysis shows that the Index has continued resisting the upward-rising trendline on the weekly charts. The upward-rising nature of the trendline is allowing the Nifty to form incremental highs; however, it is also providing strong resistance to the index as it tries to move higher.
As of now, the Index has been resisting this pattern resistance every week, and this time it faced selling pressure as well. A bearish divergence on the RSI continues to exist; the nearest support for the Index may be found at the 20-week MA which is placed at 21827
Overall, the risk-off setup might continue to persist for some time. Technical rebounds in the markets may be seen; however, it is strongly recommended that such rebounds be utilized to make exits and protect profits at higher levels.
All fresh purchases may be kept limited to defensive pockets, and more emphasis must be placed on getting into stocks with stronger relative strength as such stocks tend to offer resilience during corrective times.
Overall, while keeping leveraged exposures at modest levels, a cautious outlook is advised for the coming week.
Thanks for reading.
Keep Trading
Stay Invested
Regards,
Neeraj Bhatia
(Managing Director)
Disclaimer: I am a National Stock Exchange-certified Technical Analyst and Chartist but not a SEBI-registered analyst, so consult your financial advisor before taking any trade. This technical weekly post-market journal is only for learning purposes and it is downloadable free of cost. The views written here are entirely only my personal views. I am not forcing anyone to follow my thoughts. I do not have any WhatsApp Group ID or Telegram ID related to it.


Comments