


Nifty -Bullish Reversal Pattern; Weekly Range 22000 to 22700; Volatility will rise till the Election Results
- Neeraj Bhatia
- Apr 21, 2024
- 8 min read

In the coming week, the market is expected to react to Wipro and HDFC Bank earnings that was announced over the last weekend. Overall, the benchmark indices may consolidate further with focus on the March FY24 quarter earnings, advance estimates for quarterly US GDP, and Middle East tensions.
Post Market Weekly Analysis
The Nifty 50 weekly Index opened at 22339.05 touched the high level of 22427.45 and slipped down to 21777.65 before closing at 22147. So the benchmark index oscillated in a range of 649.80 points over the previous week's trading sessions, finally closing with a loss of 372.40 points, i.e. in percentage term (-1.65%) on a week-on-week basis.
Nifty 50 Index Monthly Chart
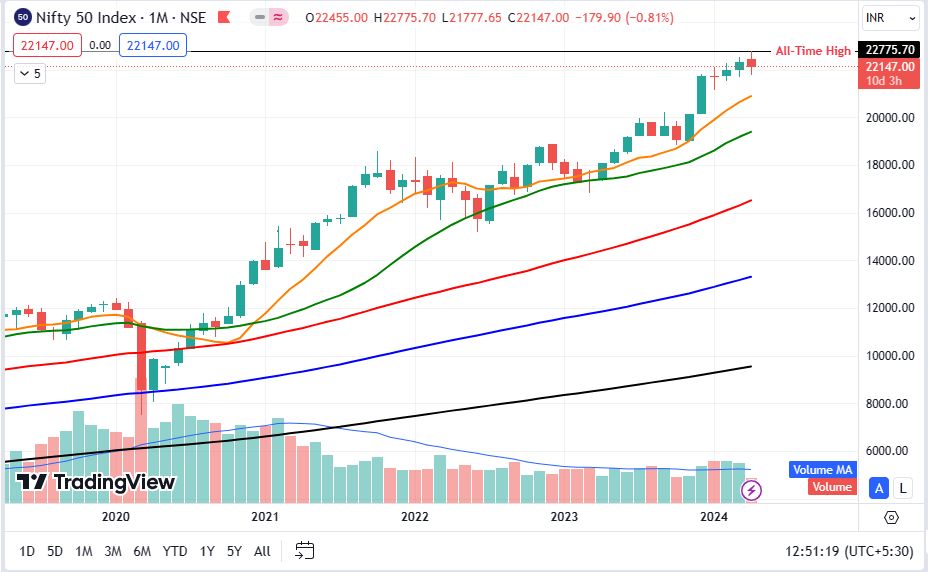
The level of 21710, was the lowest level of last month, Luckiliy, this month market saved it and dipped and touched the low of 21777.65. We believe that for month of April, 2024, at least market has created it support level. Now going forward, whenever, market ill break 21700, it will become weak and can show further downside.
Nifty 50 Index Weekly Chart

The weekly chart suggest that the market was weak entire week, before it started recovering from the week's low level 21777.65. It showed smart recovery and covered the losses of 66% approximately of its weekly losses, during the week. But compare to previous week trading candle, it is still in weak zone.Upside is still capped at 22775, which was created prvious week in the name of all-time high.
Nifty 50 Index Daily Chart

After four days of downfall, al last, fall was arrested on the last trading day of the weekly session. But the volume was not enogh to cover the entire loss of previous day's volume. 50-Day SMA stands on 21725 , from where market has taken support.
In the coming week, short covering could be continued for a while, but we can see any runway move from here so far.
Nifty 50 Weekly Fibonacci Chart Status

For this week, we can ssume that 0.786 could be the possible resistance, where profit booking bouts will take place regularly. And 0.236 could emerge as a big support for April month series.
Nifty 50 Index Weekly Chart -with Technical Indicators

RSI Indicator Pattern
The weekly RSI is at 61.77; it has marked a new 14-period low which is bearish. It however stays neutral and does not show any divergence against the price..
MoneyFlow Indicator
This weekly indicator is at 61.18 which suggest a technical boune is pending before any big move, and the moe can be either side.
MACD Indicator Pattern

The weekly MACD is bearish and trades below its signal line.
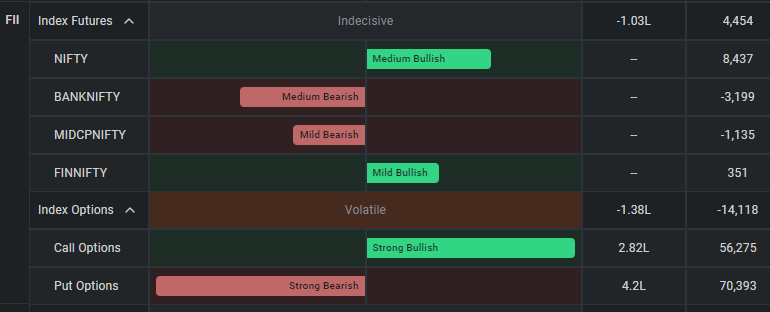
FII's & DIIs Cash Weekly and Monthly Activities
Foreign institutional investors continued with heavy selling for yet another week after elevated US bond yields and higher-than-expected US inflation, dampening the market sentiment.
They seemed to be a big seller in the technology stocks. Hence, further selling if any going ahead may limit market upside to some extent, though domestic institutional investors have consistently been providing great support the market, in fact they have been buying on every dip, but yes, they are short of matching the numbers with FIIs's numbers for sure.
FIIs net sold Rs 11,867 crore worth of equity shares in the cash segment during the last week, taking total monthly outflow to Rs 22,229 crore in April, while DIIs have net bought Rs 12,233 crore during the week and their monthly net buying was Rs 21,269. This showed that DIIs continued to compensate the FII outflow.
Outlook for the NIFTY 50 Index for the Coming Week
Markets are likely to see volatility in a broader range on the back of divergent cues. On the negative side, flare-up in geo-political tension in the Middle East, hawkish US Fed comments, and FIIs selling are making investors restless. On the positive side - expectations of healthy earnings from index heavyweights and buying emerging at lower levels are showing strength in the market
From a technical perspective, the markets have dragged their resistance points lower. While the high point of 22775 has become an intermediate top for the Nifty, the immediate resistance has been dragged lower to 22427 which is the high of the previous week. On the lower hand, the 20-week MA which is placed at
21921 can be considered as immediate support on a closing basis. The 100-DMA also falls in the close vicinity; it currently stands at 21729. Over the coming days, we can largely expect the Nifty to remain in a broad trading range with 22450-22500 working as strong resistance points.
Next week focus would remain on earnings season along with global cues. "Investors would also track economic data points like manufacturing & service PMI data of the US & India, US Q1 GDP numbers, and Japan’s policy statement
India VIX:
The volatility index rose for all four days in the current week. The India VIX rose from 11.53 on April 12 to 13.46 on April 19, and gave discomfort to the bulls. However, the volatility cooled off marginally on Friday giving some respite to the bulls. With a strong bullish reversal candle formation on the weekly chart, any fall in the VIX can give comfort to the bulls in the coming week as we approach the last week of the April series.
Overall the volatility spiked; India Vix surged by 16.69% to 13.46.
Further, given the monthly expiry for April Futures & Options contracts during the week ahead, the volatility can't be ruled out
Support Level for the Coming Week for NIFTY:
The broader support level on the technical chart could be 22000, followed by 21780 levels.
Resistance Level for the Coming Week for NIFTY:
The broader resistance level on the technical chart could be the level of 22450, followed by 22700 levels.
Important Upcoming Monthly/Weekly Activities
On the domestic front, the market participants will focus more on the corporate earnings and hence there will be more stock-specific action. Nearly 160 companies will release their quarterly earnings scorecard next week which have nearly 34 percent weightage in the Nifty 50.
US GDP
Globally, investors will focus on the advance estimates for US GDP for the first quarter of 2024, releasing on April 25. There is an anticipation of strong US GDP data for the quarter, against 3.4 percent reported in Q4-2023.
Investors would also track economic data points like Manufacturing and Services PMI flash data for April, and weekly jobless claims numbers from the US next week.
Global Economic Data
Further, Japan’s policy statement, and Manufacturing & Services PMI flash data for April, from Japan & Europe will also be watched by the market participants. The Bank of Japan is expected to keep short-term interest rates unchanged at its next policy meeting on April 26.
Domestic Economic Data
On the domestic front, the market participants will keep an eye on HSBC Manufacturing and Services PMI Flash numbers for the month of April, which will release on April 23. In March, Manufacturing PMI came in at 59.1 and Services at 61.2, against 56.9 and 60.6 respectively in previous month.
Foreign exchange reserves for the week ended April 19 will be released on April 26.
Crude Oil
The decline in oil prices below $90 a barrel seems to be indicating that there may be limited prospects of escalation in Iran-Israel tensions. But still the market will keep an eye on the same and hence, there may be some volatility in the oil prices in the near term.
Brent crude futures, the international oil benchmark, closed with 3.5 percent losses at $87.29 a barrel during the last week despite military strikes carried out by Iran and Israel on each other's areas, after climbing up to $92.18 a barrel in the previous week. WTI crude futures closed at $83.34, down 2.7 percent for the week.
We believe in short term oil prices will remain extreme volatile with moves in either direction based on the news, while long term fundamental remain support for oil prices. Any retaliation from Iran could see rally in oil, else we expect WTI to test the support of $80 in coming week
Technical Analysis
Technically, the trend seems to have turned strong with the formation of Bullish Piercing Line and Double Bottom kind of patterns on the daily charts, which are considered to be bullish reversal patterns.
Further, the index also defended its rising support trendline on closing basis,aligning closely with the psychologically significant 22,000 mark. Hence, we expect the uptrend to extend to 22,300 in the coming sessions and holding the same can take it towards 22,500 level, with support at 22,000, followed by 21,900.
Analyzing the daily chart, formation of a Piercing Line pattern, further reinforcing bullish sentiment. Additionally, the indicator has breached the 55-day exponential moving average (EMA) set at 22,067, indicating a positive short-term trend. A close above this moving average strengthens the bullish outlook
Reading Current Option Data
The monthly options data also indicated that 22,300 is expected to be next resistance area for the Nifty 50, followed by 22,500 level, with support at 22,000 level.
Overall, the 22,000 is expected to be key level to watch in the coming week.
As per the monthly options data, the 23,000 strike owned the maximum Call open interest, followed by 22,500 and 22,300 strikes, with meaningful Call writing at 22,500 strike, then 23,000 and 22,600 strikes.
On the Put side, the maximum open interest was seen at 22,000 strike, followed by 21,000 and 21,500 strikes, with writing at 21,800 strike, then 21,900 & 21,700 strikes.
Meanwhile, the India VIX, the fear gauge, rallied 16.7 percent during the week to 13.46 level, but could not sustain above 14 level. The rising volatility gave discomfort for bulls since the beginning of week, but cooling down marginally from 14 level on Friday putting bulls at a bit of comfortable position. Hence, if the volatility declines further then there may be more comfort in the bulls' camp
Participant Wise Final F&O Weekly Summary

FII's, PRO, and Clients F&O Summary by Segment
1). FII's positions as of the last trading day:
2). PRO's position as of the last trading day:

3). CLIENT's position as of the last trading day:

Summary - Overall
The technical analysis of the weekly chart shows that the last phase of the upmove on Nifty had come with a strong bearish divergence of the RSI against the price. While the Index moved higher forming higher highs, the RSI was seen forming lower tops which led to the emergence of the bearish divergence.
All in all, the coming week may see some continued technical pullback. However, at the same time, the markets continue to remain prone to face selling pressure at a higher level. It is also likely that apart from shortcovering led bounces in the markets, it largely continues to display a risk-off sentiment.
This could lead to defensive pockets like IT, Pharma, FMCG, etc., trying and display a better relative strength.
Overall, it is strongly recommended that one must curtail leveraged exposures. While staying extremely selective, a highly cautious approach is advised for the coming week.
Thanks for reading.
Keep Trading
Stay Invested
Regards,
Neeraj Bhatia
(Managing Director)
Disclaimer: I am a National Stock Exchange-certified Technical Analyst and Chartist but not a SEBI-registered analyst, so consult your financial advisor before taking any trade. This technical weekly post-market journal is only for learning purposes and it is downloadable free of cost. The views written here are entirely only my personal views. I am not forcing anyone to follow my thoughts. I do not have any WhatsApp Group ID or Telegram ID related to it.


Comments